Tools · Free calculator
Risk-Reward Calculator
Not financial advice. This tool does not recommend a trade, a target, or a position size. It has no broker connection, no market data feed, and no order path. Most people who day trade lose money.
The price at which the idea is invalidated in this long example.
Leave blank to see the risk and reward per share. Add shares for the full position.
Risk-reward result
Fill in the entry, stop, and target. The ratio appears here; no data leaves your browser.
Not financial advice. This calculator is arithmetic for an educational plan. It has no broker connection, no market data, and no order path. A higher R:R does not mean a setup is more likely to win, and it does not promise a profit.
How the risk-reward calculator works
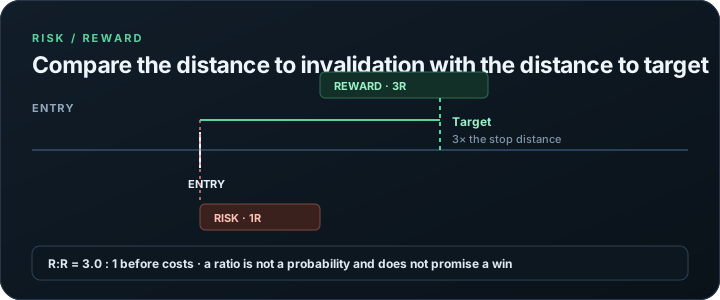
The calculator compares two distances. Risk per share is the entry price minus the stop price. Reward per share is the target price minus the entry price. Dividing reward by risk gives the reward-to-risk ratio. If the planned risk is $2.00 per share and the planned reward is $6.00 per share, the ratio is 3:1.
reward per share = target − entry
R:R = reward per share ÷ risk per share
break-even hit rate = 1 ÷ (1 + R:R)
The optional share count turns the per-share figures into a full-position loss and profit. That can be useful for a paper plan: it shows whether the arithmetic fits the risk budget you set with the position size calculator. It still does not account for fees, slippage, or the chance that the stop fills at a worse price.
What the ratio does not tell you
A 3:1 ratio sounds attractive, but it says nothing about how often the target is reached. A strategy with a large target and a low hit rate can lose money. A strategy with a small target and a high hit rate can also lose money after costs. The ratio is one input into a plan, not a verdict on the plan.
The break-even hit rate shown in the result is the mathematical win rate needed to break even at that ratio, before costs. It is useful for understanding the trade-off between risk, reward, and frequency. It is not a prediction, and it should not be treated as a probability of success.
Targets are especially easy to fit to a narrative after the fact. A target should come from the setup and the conditions you are studying, not from a desire to make the ratio look better. If moving the target farther away makes the idea less plausible, the higher ratio is not an improvement.
Putting the ratio into a paper-first process
- Write the entry, stop, and target before the session. Do not adjust them to fit a result.
- Size the position from the stop distance and a risk budget, not from the ratio.
- Journal the planned ratio and the realised outcome separately. They answer different questions.
- Review a series of decisions, not one trade. A single ratio or outcome says very little.
- Include fees and slippage in the review even when the calculator does not.
Use the paper trading guide to rehearse the full loop, then read the how to start day trading roadmap for the order of study. The safety checklist covers the approval and paper-default rules around trading software.
Compliance note. DayTraderSkill.com is not a broker, investment adviser, or signal service. This calculator does not execute trades and does not provide personalised advice. No profit is promised.
Frequently asked questions
How is the risk-reward ratio calculated?
Risk per share is the entry price minus the stop price. Reward per share is the target price minus the entry price. The ratio divides reward by risk, so a $2 risk and a $6 reward gives a 3:1 reward-to-risk ratio.
What does a 2:1 risk-reward ratio mean?
It means the planned reward is twice the planned risk, before fees and slippage. It does not mean the trade is twice as likely to work. A high ratio can still lose money if the setup rarely reaches the target.
Is the break-even hit rate a prediction?
No. It is the arithmetic win rate needed to break even at that ratio, ignoring costs. It is not a forecast, and it says nothing about the quality of the setup or the probability of reaching the target.
Does this calculator place trades?
No. It runs entirely in your browser with no broker connection, no login, and no market data feed. It cannot place, modify, or close an order, and it does not recommend a trade.
Should I use a wider target to improve the ratio?
Not automatically. Moving a target farther away can make the ratio look better while making it less likely to be reached. The target should come from the plan and the market structure you are studying, not from a number that looks attractive in a calculator.